
This is the second in our series that’s diving into the User-Centered Design (UCD) Process. In this article, we’ll be walking through the second phase of UCD, which is Define.
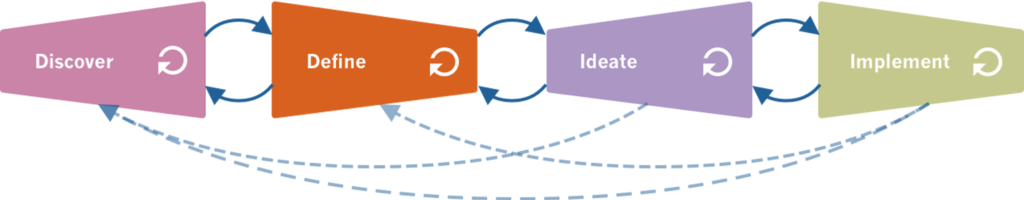
In the first phase, Discover, you’ll have conducted secondary and primary research to learn everything that you could about your users, their goals, and the obstacles in their way. In the Define phase, you’ll process and analyze all of that information, transforming it into a knowledge base that is filled with research insights and design implications that will help generate solutions as you move on to the next phase.
While Discover relied on generative or expansive thinking, Define relies on evaluative thinking. Evaluative thinking is what you do when you analyze information and then use that information to evaluate and refine theories and discoveries. This is the type of thinking that helps you narrow in on a solution that will meet your users’ needs.
The first step in Define is to analyze your data; however, it’s nothing like analyzing quantitative data. At Daedalus, we use a process called affinity sorting, an interactive process in which we sift through all of what we saw and heard during our research, looking for trends and solitary—but interesting—findings.
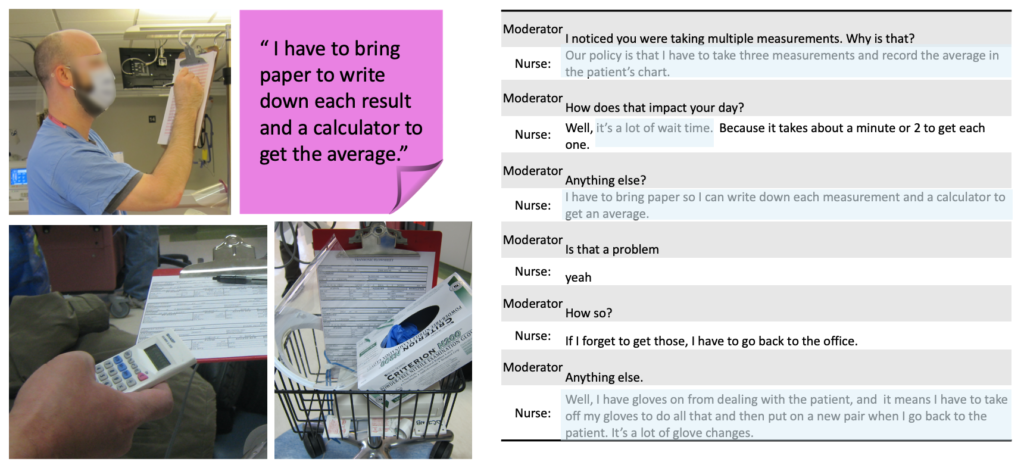
Affinity sorting isn’t a difficult process, but it can be a bit time-consuming. We first capture relevant observations from our research on affinity cards, which can be post-it notes, index cards, or printouts—anything that can be easily moved around and repositioned. Relevant observations can be direct quotes from users you interviewed, observations you took note of in the field, as well as any relevant pictures you may have captured. We draw them from visit reports, debriefing notes, videos and photos from the visits, and interview transcripts.
For example, here are some observations and quotes from research we conducted in a dialysis unit a few years ago that were later turned into affinity cards.
When creating affinity sorting cards, there are a few key things to keep in mind:
- Avoid combining multiple observations on a single affinity card—keep them modular and distinct, so they can be sorted separately.
- Make sure to choose rich, detailed, and vivid observations that are specific enough to preserve the relevant details.
- Avoid summarizing or explaining on affinity cards—just record what was seen and heard.
- Remember: it’s better to have too many cards than to have too few at this stage.
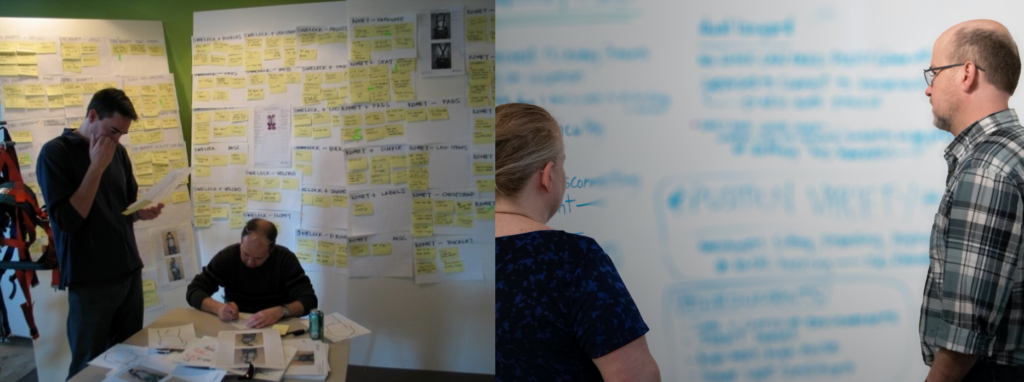
Once our sorting cards are ready, the research team takes over our office’s conference room. It has a large table and is surrounded by wall-mounted whiteboards, so it gives us plenty of room to work. As a team, we discuss the contents of the cards and begin clustering them into meaningful groups. Often, we start by categorizing cards into topic groups and then work towards more nuanced clusters that begin to tease out some of the commonalities and differences. Once we’re happy with our clusters, we articulate the theme that is represented by each.
We’ll generally take a few hours or even the better part of a day for the first round of sorting. If we can, we’ll leave everything up for a day or two, and come back with fresh eyes. Other themes almost always emerge after we’ve taken a bit of a break.
The room usually ends up looking like this:
After affinity sorting is complete and we’ve identified the themes of the research, it’s time to transform those research insights into implications and design criteria.
A research insight is a pattern detected from your research. It is often the theme of one of your clusters and either builds from a need that you heard expressed multiple times or it may stem from interesting comments you heard from a single participant. An implication re-expresses your insight into a problem to be solved or a desire to be fulfilled, which will eventually become your design criteria.
Consider this example of the process from observation → insight → implication→ design criteria for a hemodialysis monitor:
Observations: During visits, some clinicians mentioned having forgotten to tell the device that they had moved to and were measuring a new patient. Another mentioned that he’d once forgotten to reinstate the patient’s blood lines before moving to a new patient, and another mentioned almost forgetting to unclip the sensors from the patient’s blood lines before moving the device.
Insight: There are numerous issues related to moving the device between patients.
Implication: There is a need for the clinician to be reminded of several steps that he or she needs to do before moving the device to a new patient.
Design criteria: 1) The device should detect when it is moved and 2) the device should provide alerts to the user when movement is detected if there are required steps that they have not taken.
Each cluster that you end up with and its relevant insight should similarly be transformed into implications and design criteria.
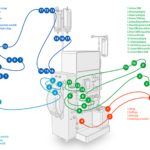
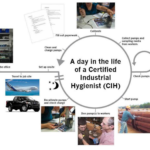
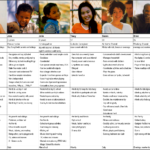
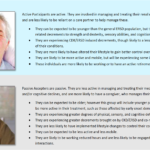
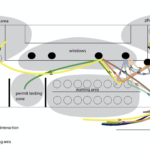
During the Define phase of UCD, we also create visual frameworks that capture the information that we are learning. A visual framework organizes complex information into a compelling story; one that guides solutions and can easily be shared outside of the core team to communicate the research findings and the team’s progress.
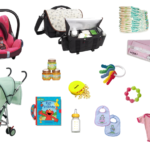
Visual frameworks help you to better understand and explore your data, and also provide an avenue for other stakeholders (like administrators whose buy-in you might be aiming for) to be able to understand what you’ve learned. Visual frameworks include personas, user profiles, journey mapping, day-in-the-life-of diagrams, personal inventories, task analyses, behavioral mapping, and stakeholder mapping: examples of which are provided below.
This process ensures that your design requirements are grounded in actual customer research, rather than being based on assumptions, preconceptions, and the personal experiences of the development team. It allows you to solve problems at the aggregate level, rather than one at a time. And it allows you to develop a deeper level of understanding and empathy for users, especially for things that aren’t as obvious on a first pass.
Check back soon for more articles detailing the next phases in user-centered design: Ideate and Implement.